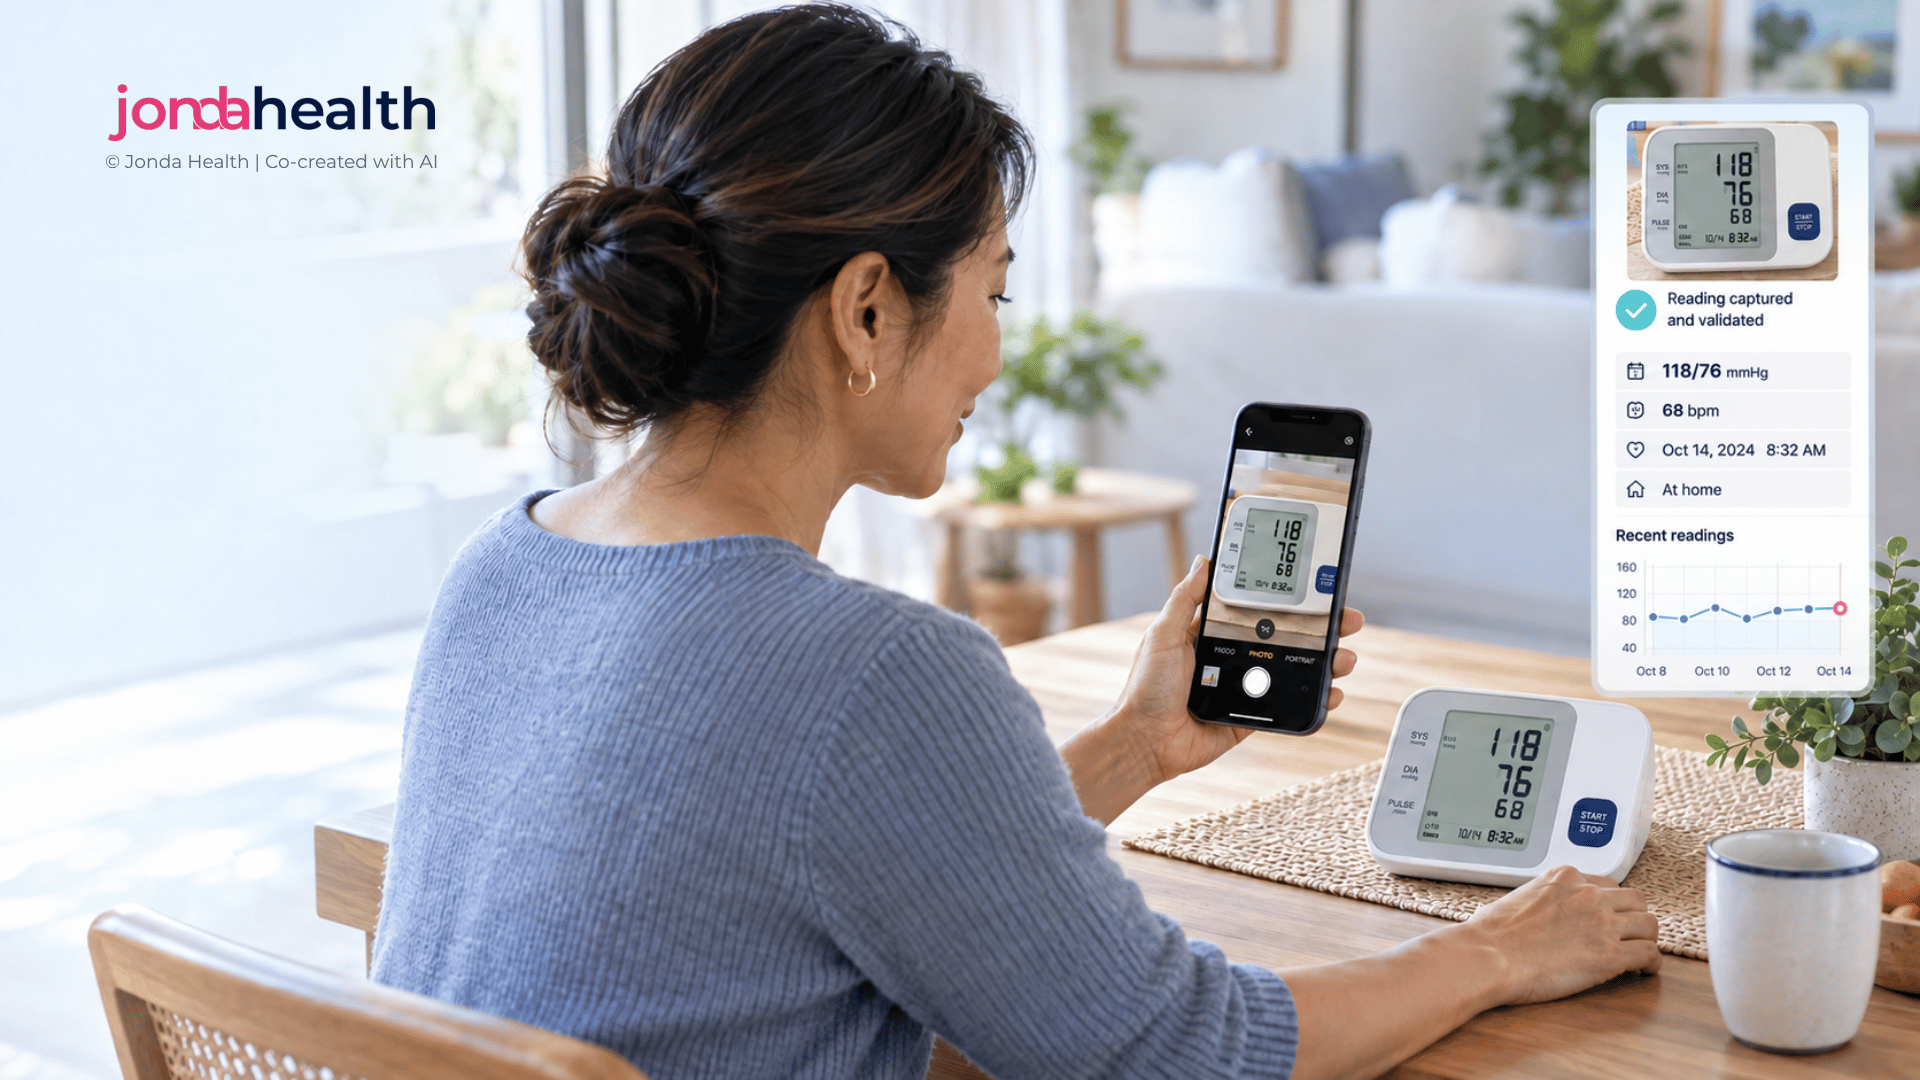
In many markets, remote monitoring does not start with a connected device. It starts with a basic glucose meter or blood pressure monitor and a phone camera. This guide is for telehealth teams running diabetes, hypertension and maternal health programmes who want those photos to become data a care team can act on.
Connected devices that send readings straight to a platform are a good fit for some programmes, but they are expensive, they need pairing and charging, and they depend on reliable connectivity. Across much of Africa, South Asia and Latin America, the device a patient already owns (or can be given affordably) is a standard meter with a small screen. Asking patients to photograph that screen is a practical, inclusive way to run remote monitoring at scale.
The photo is only the beginning, though. A picture of a blood pressure monitor is not a blood pressure reading until something has read the right numbers, attached the right time and patient, and checked that the result makes sense. The twelve points below are what we have found matters most when turning photographed device readings into usable data for chronic care.
Before designing the capture flow, decide what the care team actually needs. For hypertension, the European Society of Hypertension recommends home monitoring over three to seven days, with two readings taken one minute apart in the morning and the evening, seated after five minutes of rest.1 For diabetes, the question may be fasting readings, readings around meals, or any reading that feels unusual. For hypertension in pregnancy, the frequency and escalation thresholds are different again.2 The protocol tells you how many photos to expect, when to prompt the patient, and what a missing reading means.
Tip: Write the protocol in the patient's language as short prompts ("Morning, before breakfast, two readings") rather than expecting patients to remember it.
A single programme can see dozens of meter and monitor models, bought locally or received through donation schemes. Each has its own screen layout, icons and quirks: some show the date on the same screen as the reading, some display memory symbols, some show an arrow or heart icon for irregular heartbeat, and some flash between values. Catalogue the devices in your population early. If your programme supplies devices, choosing a small number of models makes every later step easier.
A number on its own is often not enough to interpret. A glucose value means something different fasting than it does an hour after a meal, and a blood pressure reading taken straight after climbing stairs is not the same as one taken after resting. Capture the context in one or two quick taps alongside the photo: fasting or after a meal, morning or evening, which arm, and whether the patient felt unwell. Good measurement technique matters just as much, including a supported arm at heart level and the right cuff size.3
Tip: Show a simple example photo at capture: whole screen in frame, device on a flat surface, no flash.
Most basic meters use seven-segment displays, where each digit is built from lit bars. These are easy for people to read in person and surprisingly hard to read from a photo. Glare from a window can hide a segment and turn an 8 into a 6 or a 9, a faint decimal point can turn 5.6 into 56, and a slightly angled photo can shift which label a number sits next to. Reliable reading needs models that understand these displays specifically, plus a confidence check that sends uncertain values for review rather than guessing.
Illustrative display. Most reading errors come from glare, angle and mixed-up rows rather than blurry photos.
A blood pressure monitor shows three numbers, and all three matter. A common error is recording pulse as diastolic, or storing systolic alone because it is the headline number. Diastolic pressure is clinically important in its own right, and trends in both values should be visible side by side. Store the three values as one linked reading with a single timestamp, and show clinicians both systolic and diastolic against the relevant home thresholds.
Illustrative data. Both values drift upwards and cross their home thresholds (135/85 mmHg)1, which a systolic-only view would only half show.
Glucose meters report in mmol/L or mg/dL depending on the market, and a meter bought abroad or received through a donation scheme may not match the local convention. Meters also display codes that are not numbers at all: "HI" and "LO" for values beyond the measuring range, error codes for strip or temperature problems, and symbols marking a control solution test rather than a patient sample. Each of these needs to be recognised and handled, not dropped or mistaken for a result. A reading of "HI" in particular is clinically important precisely because there is no number.
Pitfall: Treating a control solution test as a patient reading can make a patient look well controlled when they are not.
Device clocks drift, reset when batteries are changed, and are often never set in the first place. The time on the screen may be months out, while the time the photo was taken is usually accurate but may be hours after the reading if the patient photographs a stored memory. Decide which time you trust, record both, and flag readings where the two disagree significantly. For protocols built around morning and evening readings, this matters a great deal.
Even a perfectly read value is only as good as the device that produced it. Many blood pressure monitors on the market have never been independently validated, and registries such as STRIDE BP list the ones that have.4 The World Health Organization's HEARTS package also recommends validated automated devices for hypertension care.5 Blood glucose meters for self-testing are expected to meet the accuracy requirements of ISO 15197.6 Wrong cuff sizes and expired test strips are common sources of error that no amount of good data handling can correct.
If your programme uses pulse oximeters, for example in maternal or respiratory care, be aware that they can overestimate oxygen saturation in people with darker skin pigmentation, which matters for escalation decisions.7
Most readings can wait for routine review. Some cannot. Agree escalation rules with your clinical leads, anchored in named guidelines, and make sure a flagged reading reaches a person quickly, including out of hours. The table below shows the kind of thresholds programmes commonly use.
These are examples, not a protocol. Your clinical team should set thresholds for your population and pathway, and symptoms reported by the patient should always be able to trigger escalation regardless of the number.
Patients in rural areas may have intermittent data, prepaid bundles and older phones. Let photos queue offline and send when a connection returns, keep image sizes small without compressing away the digits, and consider messaging channels patients already use. Phones are also often shared within a household, so every submission needs a reliable way to confirm which patient it belongs to, especially where more than one family member is enrolled.
Device readings are health data, and data protection laws across these regions treat health information as sensitive. South Africa's Protection of Personal Information Act classes it as special personal information,9 Brazil's General Data Protection Law (LGPD) treats it as sensitive personal data,10 and India's Digital Personal Data Protection Act sets out consent and processing duties for personal data.11 Where a programme is funded or run through an insurer or employer, be explicit with patients about who sees their readings and for what purpose, and keep care use separate from any other use. Many programme owners will also ask whether data can be processed within the country, so plan for that from the start.
The value of remote monitoring grows over time. Structured readings let a programme show adherence to the monitoring protocol, changes in control across a population, and outcomes that matter to funders, insurers and health ministries. That requires every reading to be stored consistently, with its context, device, time and review status, and mapped to the medical coding standards your downstream systems use. It should also sit alongside data from connected devices, where you have them, so the programme has one view of each patient regardless of how the reading arrived.
We see this in a chronic disease monitoring programme we support in Southern Africa, delivered through an insurer, where photographed device readings are turned into structured data the programme team can use for follow-up and reporting.
Remote monitoring with basic devices works when the data behind it can be trusted. We help programmes get that foundation right and build the service around it.